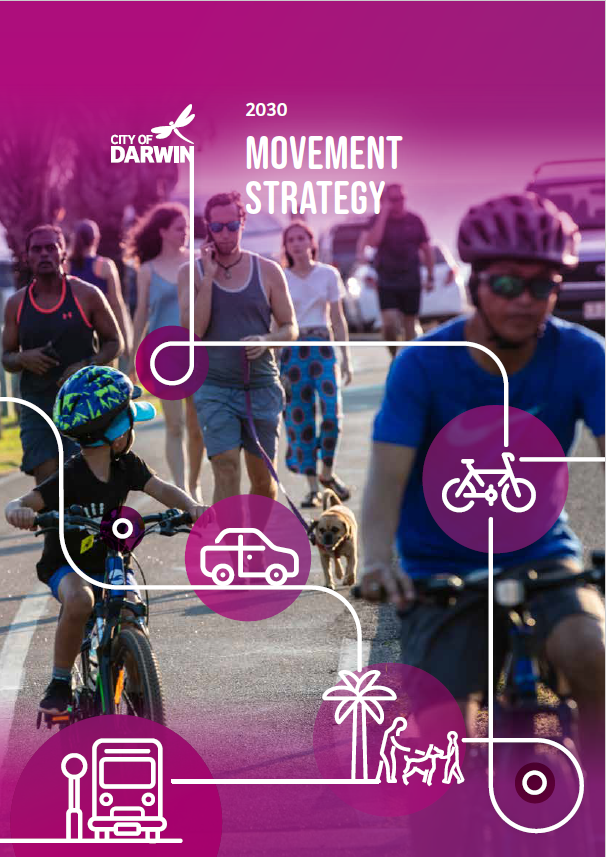
2030 Movement Strategy
City of Darwin is proud to present Darwin’s first ever Movement Strategy, which aims to make it easier for people to move around our suburbs and city by improving streetscapes, infrastructure and connectivity while reducing the impact of transport on the environment. A “people first” philosophy prioritises vulnerable people and supports active and sustainable modes of transport before car movement. The movement strategy prioritises areas such as pedestrian footpaths, shared footpaths, bicycle networks, transport links and shared mobility access to create greater connectivity.
The Movement Strategy plays an important role in supporting the City of Darwin’s sustainability goal of achieving net-zero emissions by 2040, which is embodied in the Climate Emergency Strategy, and it works hand in hand with the Greening Darwin Strategy to provide more street trees and shade.
Darwin’s movement needs:
- 112 km land area across 41 suburbs
- People with working age: 61,000
- Employees commute by public transport: 7.7%
- Employee commute by private vehicle: 80.1%
- Employee commute by active transport: 3.5%
- The high use of private vehicles is supported by a total of
- 1637 on street spaces and 1527 off street spaces in the Darwin City Centre.
Micromobility
City of Darwin has provided consent for e-scooters and e-bikes (introduced in Dec 2020) to operate in the Darwin municipality under an exclusive exemption provided by the Northern Territory Government.
We have compiled some interesting e-mobility insights gathered from the operator to showcase how this popular medium of transport is now growing within our city.
eMobility Devices - Users by Year
Annual Trips by Season
Annual Distance (km) Travelled by Season
Residents and visitors have displayed an interest in alternative green modes of transport.
In January 2020, our Micromobility provider initially introduced a fleet of 250 e-scooters and followed with a fleet of 150 e-bikes in December 2020. With the border closures during 2020, e-mobility users were significantly low compared to 2021, which was supported by a number of local events and interstate travellers.
In March 2021, an additional 250 e-scooters were introduced, and the eligibility zone expanded to allow users to move and connect around the city. With the introduction of the additional fleet, e-scooters have travelled over 1.3 million kms which is a 35% increase year-on-year.
The data above suggests that the community are now exploring new and environmentally friendly modes of transport.
eScooter Trip Start Time (Average)
eBike Trip Start Time (Average)
E-mobility rider behaviours indicate an initial higher percentage of travel in morning between 8am-10am (morning commute) and then again between the hours of 5-8pm with users choosing to ride to entertainment precincts, family rides to parks and to move and connect between different parts of the city.
Top 10 Popular Start Locations
Top 10 Popular End Locations
In collaboration with the City of Darwin, virtual parking stations were established to incentivise and encourage safe parking practices around the city. These parking stations are constantly refined using Start/End Trip data analysis to ensure they are distributed based on demand while managing occurrences of high end trip vehicle bunching.
The fleet is continuously redistributed to ensure consistent service uptime, availability, and quality throughout the deployment area. Redistribution activities take place up to 24 hours a day as local usage dictates. The e-scooters are typically redistributed multiple times within a single charging cycle.
In 2021 Darwin has seen five key locations around the city become favourite start/end trip destinations for e-mobility. This includes Mitchell Street (Mitchell x Peel Street & H Hotel Mitchell Street Stations) and Smith Street Mall (Darwin Central stations) and the Darwin Waterfront. These parking stations prove to be preferred end/start trip locations for users to reach their final destination when moving around the city.
Sustainability Outcomes - Retail Spend and Co2 Emissions
Tackling Congestion and Reducing Emissions
E-mobility services were used for end-to-end transport to entertainment precincts, to access the public transport network, and between Darwin’s iconic attractions and venues. As per rider surveys conducted by the operator in Darwin, results show that more than 56% of rides replace a trip that would have been made with a car. Based on the 1.3 million km travelled by riders, and the average diesel car emissions rate of 160g CO2-eq p-km-1, e-mobility services have helped Darwin avoid about 125 tonnes of CO2 emissions in 2021.
Supporting the Community
Micromobiltiy programs reinvigorate a city, bringing life back to local venues, retailers and restaurants through increased traffic. Rider surveys tell us that 9% of respondents would not have taken a trip if there was no micromobility option available. This amounted to 80,057 additional purchases at local retailers totalling an additional $6 million generated in sales in 2021.


As per our Micromobility provider, their 3rd generation e-scooter saves approximately 160g of CO2 emissions when compared to a motor vehicle. Based on the 450,000km of car journeys replaced by the e-scooter trial in 2020, this is the equivalent of 72 tonnes of CO2 emissions.


Based on the surveys conducted by the operator, about 56% of e-scooter rides have replaced those that would have been made by passenger vehicle. Based on the 1.3M km travelled by e-mobility riders, and the average diesel car emissions rate of 160g CO2-eq p-km-1, This amounts to 125 tonnes of CO2 emissions in 2021.